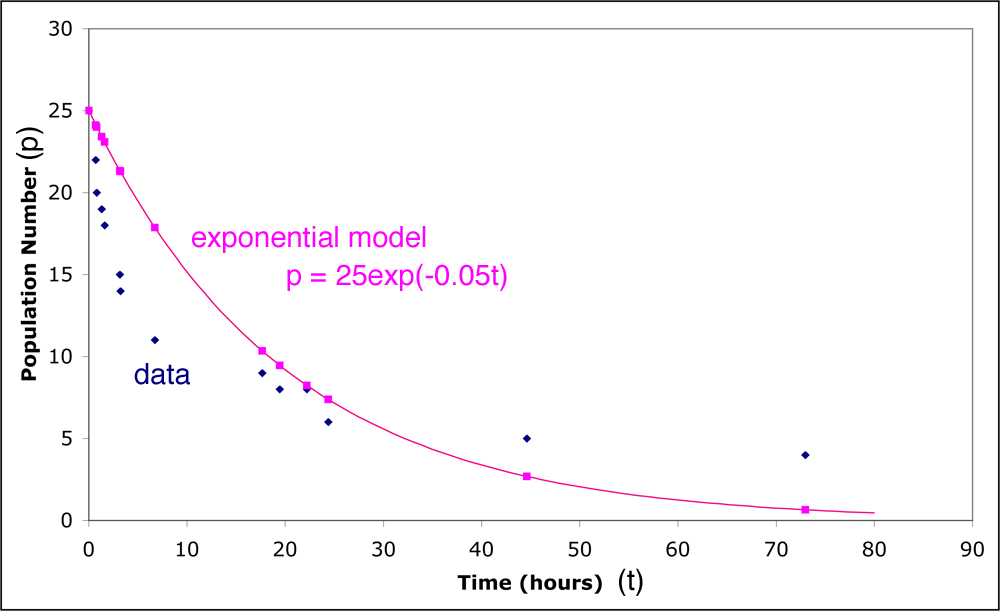
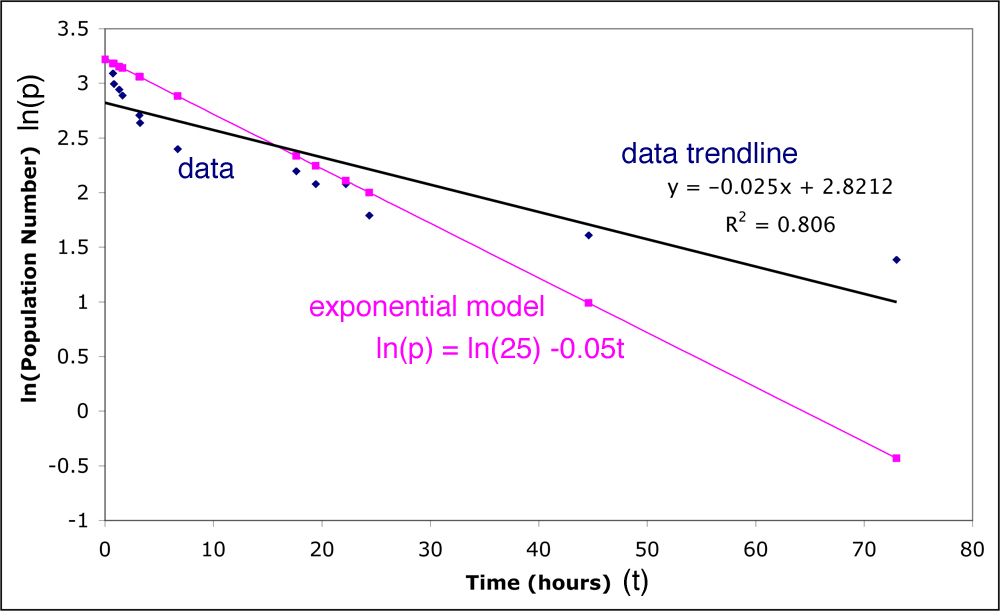
The model finds a decay constant of -0.05 +/- 0.025 per hour (Figure 1). If the natural log of the data and model are taken (Figure 2), we can see the deviation of the data from a pure exponential (represented by the linear data trend-line, and the model data), to something more complex. This could be due to the small sample size (25), and inhomogeneity in the stuck-ness of the post-it notes.